
Well, it certainly helps if your undrafted players have the ability to put up 50+ points in a season like Smith and Gambardella, or at least 30 like Kapla. These days, we're lucky to have one guy a year score over 20 points. We haven't had anyone hit 30 in almost 10 years now I believe, drafted or notUndrafted players who played for Norm that eventually played in the NHL:
Christian Folin
Chad Ruhwedel
Joe Gambardella
C.J. Smith
Michael Kapla
Kevin Boyle
Lucas Condotta
USCHO Fan Forum
-
The USCHO Fan Forum has migrated to a new plaform, xenForo. Most of the function of the forum should work in familiar ways. Please note that you can switch between light and dark modes by clicking on the gear icon in the upper right of the main menu bar. We are hoping that this new platform will prove to be faster and more reliable. Please feel free to explore its features.
You are using an out of date browser. It may not display this or other websites correctly.
You should upgrade or use an alternative browser.
You should upgrade or use an alternative browser.
UMass Lowell 2025-2026: Youth will be served
- Thread starter Will
- Start date
This guy gets it Scott now is now not when I played take off the blinders4 seasons where they went 0-13, 0-12, 4-9 and 2-10 (this last season). Not exactly leaving on a positive note with a 6-44 record (12%).
That program just hasn't worked at Lowell. No matter the coach.

ScottK
Riverhawk Radio Meteorologist and Statistician
Congratulations on commenting about half of my point while ignoring the other part. You know, that part about all those great draft picks who did absolutely nothing? Seth Barton was the 2nd highest draft pick in program history - 3rd round, 81st overall. 83 games, 7 goals, 29 assists, and a -1 overall in his 3 years in Lowell.Well, it certainly helps if your undrafted players have the ability to put up 50+ points in a season like Smith and Gambardella, or at least 30 like Kapla. These days, we're lucky to have one guy a year score over 20 points. We haven't had anyone hit 30 in almost 10 years now I believe, drafted or not
BTW, Condotta 52 points total, 23 in his senior year. Kapla only hit 30 as a senior. Folin had 21 and 20. Ruhwedel never topped 25. So your 30 point argument doesn't hold a lot of water either.
I am not, and never was, arguing that draft picks are some telltale sign of a great team, or that drafted players pan out at a high rate compared to undrafted players. I'm simply stating that we haven't had enough scoring on our team in recent years to be competing for the Hockey East championship.Congratulations on commenting about half of my point while ignoring the other part. You know, that part about all those great draft picks who did absolutely nothing? Seth Barton was the 2nd highest draft pick in program history - 3rd round, 81st overall. 83 games, 7 goals, 29 assists, and a -1 overall in his 3 years in Lowell.
BTW, Condotta 52 points total, 23 in his senior year. Kapla only hit 30 as a senior. Folin had 21 and 20. Ruhwedel never topped 25. So your 30 point argument doesn't hold a lot of water either.
When I said "We haven't had anyone hit 30 in almost 10 years now I believe, drafted or not", I am simultaneously acknowledging your point that our draft picks have not always done much in the name of scoring.
Players making the NHL is nice for the program and staff, but competing for the Hockey East championship matters much more to me personally.
As for my 30-point scorer argument? Well, I think that has all the stats in the world to back it up. In the league's history, there has been one champion that has not had multiple 30-point scorers on their roster, except for the abbreviated COVID season. That was us in 2014, with arguably the greatest goalie in net helping keep us in it.
2026: Merrimack: 37-35-35
2025: Maine: 32-30-29
2024: Boston College 71-65-60
2023: Boston University 64-49-36
2022: UMass 49-33-31
2021: UMass 34-27-24 (shortened season for COVID)
2020: Boston College (regular season champion, no tourney due to COVID): 42-42-39
2019: Northeastern: 37-31-31
2018: BU: 35-35-32
2017: UMass Lowell: 52-51-39
2016: NEU: 43-42-35
2015: BU: 71-61-50
2014: UML: 30-23-22
2013: UML: 38-38-30
2012: BC: 45-44-40
2011: BC: 52-51-33
2010: BC: 53-50-45
2009: BU: 55-50-48
2008: BC: 68-51-50
2007: BC: 53-47-46
2006: BU: 39-36-32
2005: BC: 48-45-28
2004: Maine: 44-40-33
2003: New Hampshire: 51-47-30
2002: New Hampshire: 76-66-45
2001: BC: 54-50-49
2000: Maine: 51-37-36
1999: BC: 60-57-49
1998: BC: 73-62-49
1997: BU: 62-39-35
1996: Providence: 37-36-35
1995: BU: 56-55-52
1994: BU: 54-44-42
1993: Maine: 100-95-85
1992: Maine: 65-57-56
1991: BU: 82-68-61
1990: BC: 72-63-53
1989: Maine: 67-62-49
1988: NEU: 47-47-39
1987: BC: 83-70-66
1986: BU: 74-62-38
1985: PC: 73-50-49
On a completely unrelated note: the SLU calendar has a different game time than ours for the Oct 10 game. We'll see which one is correct; I assume ours is as the host school.
 saintsathletics.com
2026-27 Men's Hockey Schedule - St. Lawrence University Athletics
The official 2026-27 Men's Hockey schedule for the St. Lawrence University Saints
saintsathletics.com
Lowell2001
Lowell Hockey Diehard
Seeing Paul Kariya's 100 points in 1993 is truly insane, lolI am not, and never was, arguing that draft picks are some telltale sign of a great team, or that drafted players pan out at a high rate compared to undrafted players. I'm simply stating that we haven't had enough scoring on our team in recent years to be competing for the Hockey East championship.
When I said "We haven't had anyone hit 30 in almost 10 years now I believe, drafted or not", I am simultaneously acknowledging your point that our draft picks have not always done much in the name of scoring.
Players making the NHL is nice for the program and staff, but competing for the Hockey East championship matters much more to me personally.
As for my 30-point scorer argument? Well, I think that has all the stats in the world to back it up. In the league's history, there has been one champion that has not had multiple 30-point scorers on their roster, except for the abbreviated COVID season. That was us in 2014, with arguably the greatest goalie in net helping keep us in it.
2026: Merrimack: 37-35-35
2025: Maine: 32-30-29
2024: Boston College 71-65-60
2023: Boston University 64-49-36
2022: UMass 49-33-31
2021: UMass 34-27-24 (shortened season for COVID)
2020: Boston College (regular season champion, no tourney due to COVID): 42-42-39
2019: Northeastern: 37-31-31
2018: BU: 35-35-32
2017: UMass Lowell: 52-51-39
2016: NEU: 43-42-35
2015: BU: 71-61-50
2014: UML: 30-23-22
2013: UML: 38-38-30
2012: BC: 45-44-40
2011: BC: 52-51-33
2010: BC: 53-50-45
2009: BU: 55-50-48
2008: BC: 68-51-50
2007: BC: 53-47-46
2006: BU: 39-36-32
2005: BC: 48-45-28
2004: Maine: 44-40-33
2003: New Hampshire: 51-47-30
2002: New Hampshire: 76-66-45
2001: BC: 54-50-49
2000: Maine: 51-37-36
1999: BC: 60-57-49
1998: BC: 73-62-49
1997: BU: 62-39-35
1996: Providence: 37-36-35
1995: BU: 56-55-52
1994: BU: 54-44-42
1993: Maine: 100-95-85
1992: Maine: 65-57-56
1991: BU: 82-68-61
1990: BC: 72-63-53
1989: Maine: 67-62-49
1988: NEU: 47-47-39
1987: BC: 83-70-66
1986: BU: 74-62-38
1985: PC: 73-50-49

River Hawks Tie for Hockey East Lead with 25 All-Academic Selections - UMass Lowell Athletics
LOWELL, Mass. – The UMass Lowell ice hockey team had 25 players named to the 2025-26 Hockey East All-Academic Team, giving them a tie for the top spot in the Hockey
 goriverhawks.com
Terrible news.
 goriverhawks.com
UMass Lowell Mourns the Passing of Toby Forsythe - UMass Lowell Athletics
LOWELL, Mass. – The UMass Lowell Athletics community is mourning the loss of men's soccer goalkeeper Tobias "Toby" Forsythe, who tragically passed away
goriverhawks.com

FiveLetterBird
Member
Scott, take the time to see what other teams don’t have a 30+ point scorer in the same time frame as Lowell and tell me with a straight face it’s not concerning company.Congratulations on commenting about half of my point while ignoring the other part. You know, that part about all those great draft picks who did absolutely nothing? Seth Barton was the 2nd highest draft pick in program history - 3rd round, 81st overall. 83 games, 7 goals, 29 assists, and a -1 overall in his 3 years in Lowell.
BTW, Condotta 52 points total, 23 in his senior year. Kapla only hit 30 as a senior. Folin had 21 and 20. Ruhwedel never topped 25. So your 30 point argument doesn't hold a lot of water either.
Point being the talent just don't come to Lowell anymoreScott, take the time to see what other teams don’t have a 30+ point scorer in the same time frame as Lowell and tell me with a straight face it’s not concerning company.
And now the professional girls are leaving Lowell And having to be you

BOSTON FLEET ANNOUNCE AGGANIS ARENA AS PRIMARY HOME VENUE FOR 2026-27 SEASON
BOSTON, MA (July 7, 2026) – The Boston Fleet announced today that the team is moving to Boston full-time, naming Agganis Arena the primary home venue for the 2026-27 season. “We couldn’t be more excited to bring the Boston Fleet to Agganis Arena full-t...
 www.thepwhl.com
Former River Hawk news:
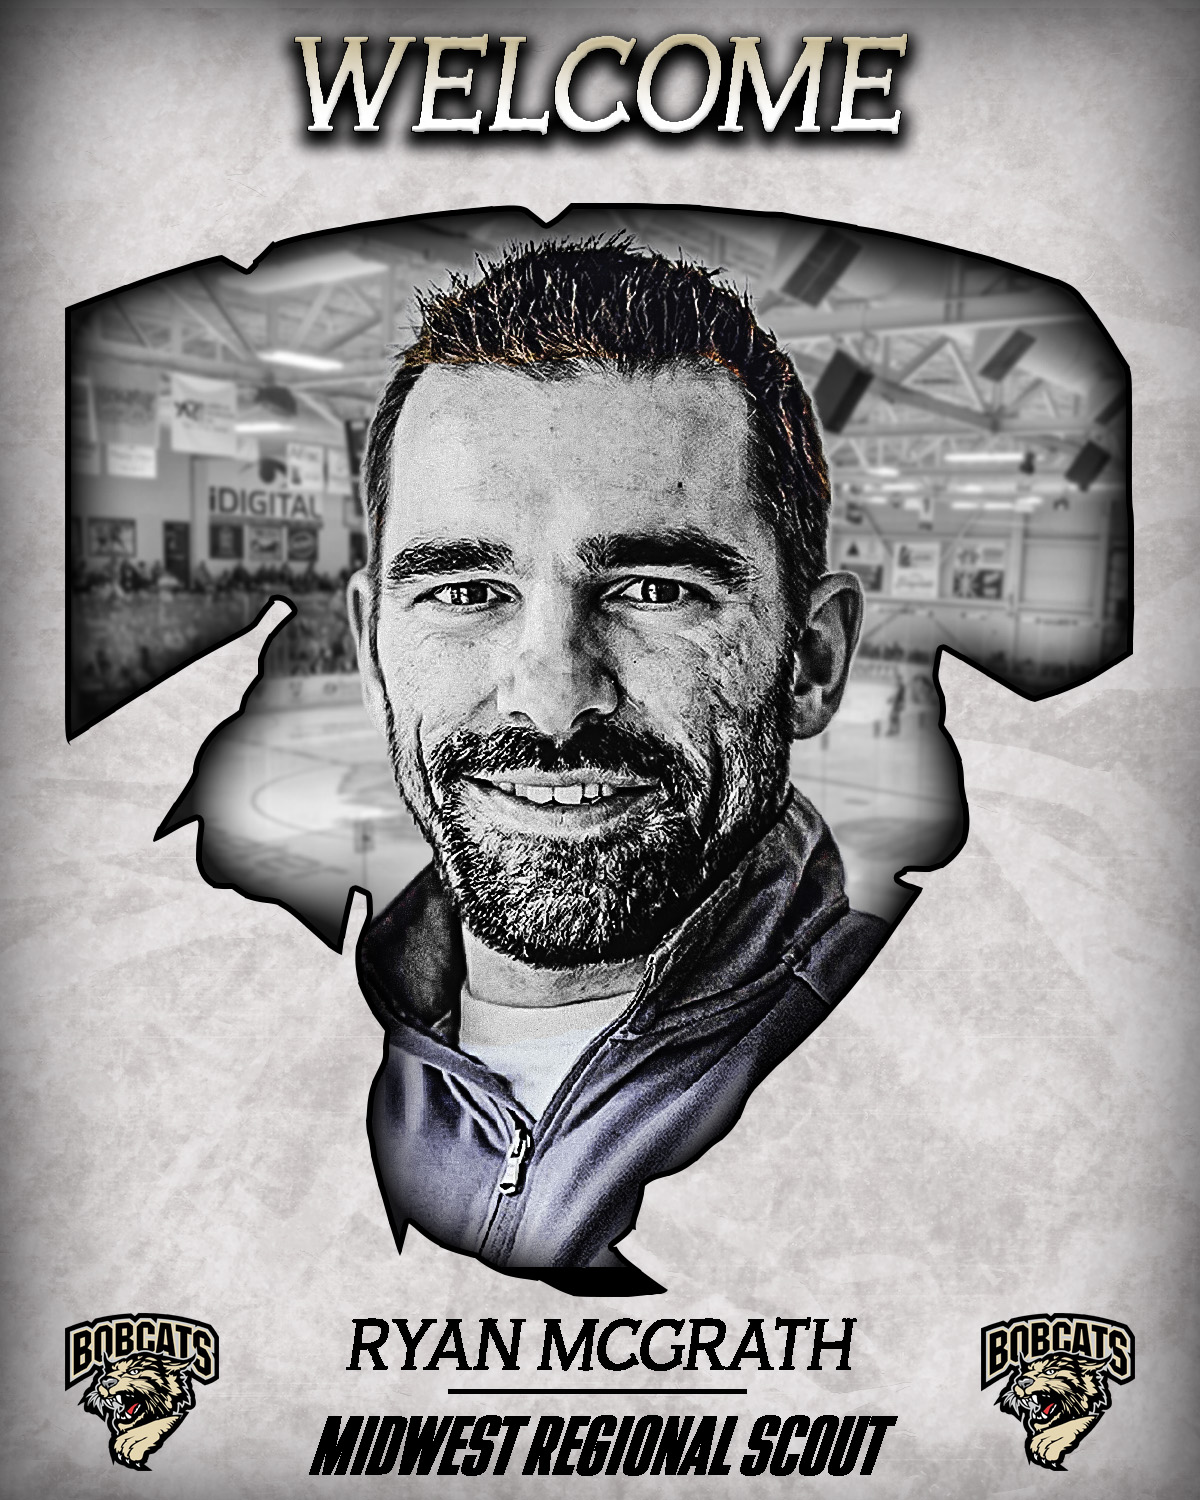
 www.bismarckbobcats.com
Bobcats Add Ryan McGrath as Midwest Regional Scout - BISMARCK BOBCATS
The Bismarck Bobcats are proud to announce that Ryan McGrath has joined the Bismarck Bobcats scouting staff for the 2026-27 season. McGrath brings a wealth of
www.bismarckbobcats.com
Per Mike McMahon:
— Multiple sources confirmed that Stavros Paskaris is the new assistant coach at UMass Lowell. The former Bowling Green assistant — who worked in the athletic department as an administrator last season — will primarily focus on recruiting. Paskaris previously coached at Dartmouth and Princeton.
Paskaris was on the recruiting trail for UMass Lowell at Select Camp last week.
— Multiple sources confirmed that Stavros Paskaris is the new assistant coach at UMass Lowell. The former Bowling Green assistant — who worked in the athletic department as an administrator last season — will primarily focus on recruiting. Paskaris previously coached at Dartmouth and Princeton.
Paskaris was on the recruiting trail for UMass Lowell at Select Camp last week.
Lowell2001
Lowell Hockey Diehard
This is an interesting one, but I like it. Good experience at the D1 level. I also wonder if this means Boschetto is completely handing off all recruiting responsibilities or just bolstering that side of the operation so he can spend more time on day-to-day coaching.Per Mike McMahon:
— Multiple sources confirmed that Stavros Paskaris is the new assistant coach at UMass Lowell. The former Bowling Green assistant — who worked in the athletic department as an administrator last season — will primarily focus on recruiting. Paskaris previously coached at Dartmouth and Princeton.
Paskaris was on the recruiting trail for UMass Lowell at Select Camp last week.
TalonsUpPuckDown
Roll along you BG Warriors!
BG guy here. Stavros recruited forwards when he was on the coaching staff. He’s responsible for a couple of guys currently in the ECHL. He did a nice job given the constraints. It’s not surprising he missed being out of the game. While he did well on the fundraising front, it’s just not the same.This is an interesting one, but I like it. Good experience at the D1 level. I also wonder if this means Boschetto is completely handing off all recruiting responsibilities or just bolstering that side of the operation so he can spend more time on day-to-day coaching.
His claim to fame is he’s best buds with the higher ups at Michigan State and Penn State and got an insider front row seat at the McKenna sweepstakes.
THN with a couple of quick notes (and some quotes) on the incoming freshmen.

River Hawks Add Stavros Paskaris as Director of Scouting/Assistant Coach - UMass Lowell Athletics
LOWELL, Mass. – UMass Lowell Hockey Head Coach Norm Bazin has announced the addition of Stavros Paskaris to the River Hawks' staff as Director of Scouting/Assistant
goriverhawks.com
umlhockey22490
Member
With the current landscape of recruiting, I think you need team scouting (for potential portal moves or marjor juniors) and youth scouting to be two separate things. I wouldnt be surprised if Boschetto has his eyes on major juniors/ NCAA, while Paskaris has Intl/ youth recruits. But Coach Boschetto has three young kids as well (you all have probably seen them running around in the arena), so that could be the other factorThis is an interesting one, but I like it. Good experience at the D1 level. I also wonder if this means Boschetto is completely handing off all recruiting responsibilities or just bolstering that side of the operation so he can spend more time on day-to-day coaching.

UMass Lowell Hockey (@RiverHawkHockey) on X
Coach is up north 🇨🇦 Coach Bazin caught up with some former River Hawks in Toronto! #UnitedInBlue | #AlwaysARiverHawk