I was asked to post this here. With caveat that the attendance figures might not be 100% accurate I've complied the average attendance for the 12 current ECAC teams for 2001-2023:
| | 2001-02 | 2002-03 | 2003-04 | 2004-05 | 2005-06 | 2006-07 | 2007-08 | 2008-09 | 2009-10 | 2010-11 | 2011-12 | 2012-13 | 2013-14 | 2014-15 | 2015-16 | 2016-17 | 2017-18 | 2018-19 | 2019-20 | 2021-22 | 2022-23 |
| Brown | 1,488 | 1,499 | 1,602 | 1,256 | 1,262 | 1,485 | 1,224 | 1,127 | 1,294 | 1,474 | 1,374 | 1,262 | 1,448 | 1,011 | 1,097 | 950 | 861 | 780 | 643 | 392 | 797 |
| Clarkson | 2,975 | 2,777 | 2,496 | 2,328 | 2,327 | 2,514 | 2,734 | 2,851 | 2,647 | 2,261 | 2,449 | 2,397 | 2,500 | 2,460 | 2,583 | 2,709 | 2,807 | 2,766 | 2,820 | 2,457 | 2,510 |
| Colgate | 1,727 | 1,830 | 1,886 | 1,773 | 1,805 | 1,774 | 1,577 | 1,141 | 1,161 | 1,010 | 1,294 | 1,312 | 1,567 | 1,515 | 1,599 | 1,814 | 1,352 | 1,216 | 1,188 | 797 | 976 |
| Cornell | 3,802 | 3,836 | 3,836 | 3,836 | 3,836 | 4,229 | 4,191 | 4,153 | 4,264 | 4,187 | 4,238 | 4,247 | 4,088 | 4,125 | 4,022 | 3,908 | 3,592 | 3,594 | 3,979 | 2,685 | 3,730 |
| Dartmouth | 3,253 | 3,738 | 4,038 | 3,766 | 4,016 | 3,809 | 3,489 | 3,480 | 2,935 | 2,824 | 3,112 | 3,304 | 2,927 | 2,651 | 2,372 | 2,562 | 2,040 | 2,084 | 1,951 | 801 | 1,706 |
| Harvard | 2,354 | 2,040 | 2,116 | 2,287 | 2,275 | 2,362 | 2,381 | 2,086 | 2,387 | 2,380 | 2,224 | 2,306 | 2,291 | 2,138 | 2,385 | 2,466 | 2,155 | 1,981 | 1,805 | 1,194 | 2,415 |
| Princeton | 1,816 | 1,935 | 1,637 | 1,717 | 1,635 | 1,368 | 1,702 | 1,575 | 1,545 | 1,581 | 1,858 | 2,064 | 1,942 | 1,933 | 1,851 | 1,635 | 1,601 | 1,859 | 1,806 | 1,134 | 1,720 |
| Quinnipiac | 821 | 921 | 955 | 831 | 1,875 | 2,374 | 2,922 | 2,906 | 2,671 | 2,708 | 2,524 | 3,122 | 3,434 | 3,123 | 3,247 | 3,132 | 3,095 | 3,123 | 3,024 | 2,508 | 2,968 |
| RPI | 3,023 | 3,186 | 2,966 | 3,169 | 3,128 | 3,715 | 3,534 | 3,268 | 2,859 | 3,158 | 3,435 | 3,132 | 3,255 | 3,373 | 3,143 | 3,087 | 3,013 | 2,880 | 2,671 | 367 | 2,251 |
| St. Lawrence | 2,527 | 2,180 | 2,348 | 2,262 | 2,292 | 2,501 | 2,377 | 2,418 | 2,213 | 1,646 | 1,399 | 1,545 | 1,688 | 1,658 | 1,782 | 1,686 | 1,505 | 1,206 | 851 | 1,005 | 1,567 |
| Union | 1,756 | 1,853 | 1,595 | 1,630 | 1,713 | 1,794 | 1,737 | 1,815 | 1,878 | 1,886 | 2,009 | 1,981 | 1,908 | 2,106 | 1,997 | 2,101 | 2,055 | 1,854 | 1,841 | 1,490 | 1,844 |
| Yale | 3,804 | 3,407 | 3,255 | 3,150 | 3,095 | 3,034 | 2,927 | 2,910 | 3,124 | 3,275 | 3,169 | 3,138 | 3,343 | 3,312 | 3,385 | 3,090 | 3,210 | 3,046 | 2,036 | 788 | 1,864 |
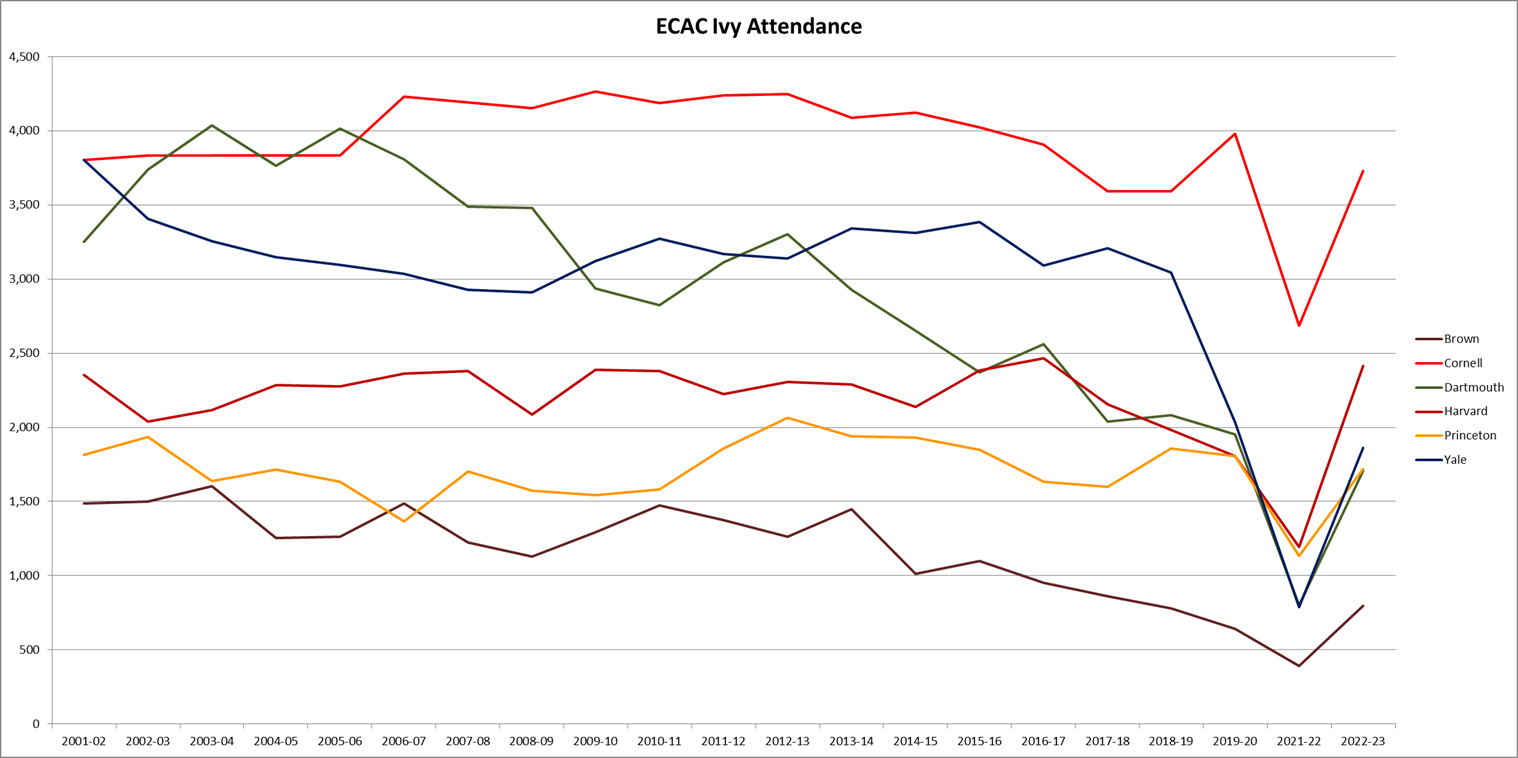
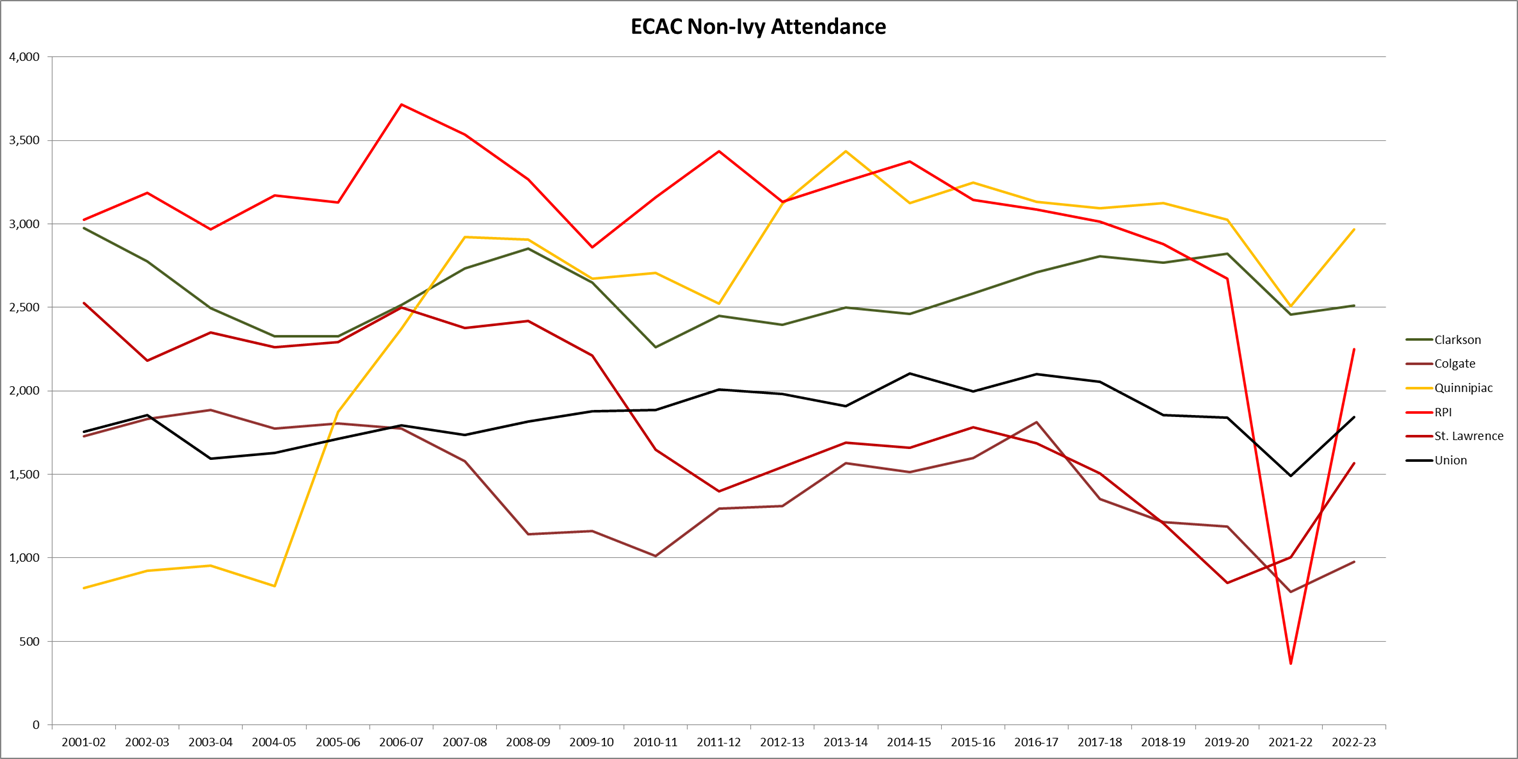
To make it easier to see visually I created 2 charts: one for Ivy teams and one for non-Ivy teams:
Except for three* seasons Cornell had the best average attendance, toping 4,000 for a decade, 2006-16. Attendance dropped off for 2 seasons, 2017-19, but rebounded nicely in 2019-20. After a post-COVID season with reduced attendance it was back up this season, although it was down from the 2019-20 average.
Perhaps surprisingly, Dartmouth was the attendance leader for 2 of the seasons Cornell wasn't, was second for 5 seasons, third for 3 seasons and 4th for 2 seasons from 2001-13. This despite, as the OP stated, not making the NCAA Tournament since 1980. Since 2013 attendance as trended downward.
Another Ivy with strong attendance from 2001-19 was Yale, which only had 2 seasons averaging below 3,000, before a sharp drop off in 2019-20 and which continued downward this past season.
Harvard has middling attendance from 2001-18, fluctuating between 2,500 and 2,000, before dropping below 2,000 in 2018-19 and then lower in 2019-20. This season it rebounded nicely, back up over 2,400.
The best attendance among the non-Ivy schools has been RPI and Quinnipiac. RPI was above 3,000 for 15 of 17 seasons from 2001-18. After 2 seasons of declining attendance it dropped again this past season as much has it had from 2018-20.
Quinnipiac's attendance has been among the tops since their current arena opened in 2007, but it increased during their almost championship season and stayed above 3,000 until the 2021-22 post-COVID season, while it was just short of 3,000 this season.
The three teams with the worst attendance since 2001 have been Brown, Colgate and St. Lawrence. Brown had low, but relatively stable attendance until 2014. Since then it was been gradually dropping and has been the worst in the league the past six seasons.
Colgate also had low, but stable attendance from 2001-08, before dropping to barely over 1,000 from 2008-11, before slowing improving over the next six seasons, reaching where it was 2001-07. However, attendance dropped again through 2020 and collapsed below 1,000 in the post-COVID season, from which attendance only improved slightly this past season.
St. Lawrence likewise had stable attendance from 2001-10, before it dropped in 2010-11 and then stabilized at a new lower, level until Appleton was closed for renovations. This past season attendance returned to that level.
Sean
*In 2001-02 Yale edged out Cornell, 3,804 to 3,802