Announcement

Collapse
No announcement yet.

Average Men's Attendance

Collapse
X
 
  • Filter
  • Time
  • Show
Clear All
new posts

  • Re: Average Men's Attendance

    Originally posted by UMD21 View Post
    I wasn’t aware UW hockey attendance was hurting. Seems to me you would have been one of the schools hurt the least if not benefitted from B1G conference. Kinda surprised, must be results driven.
    Exactly!

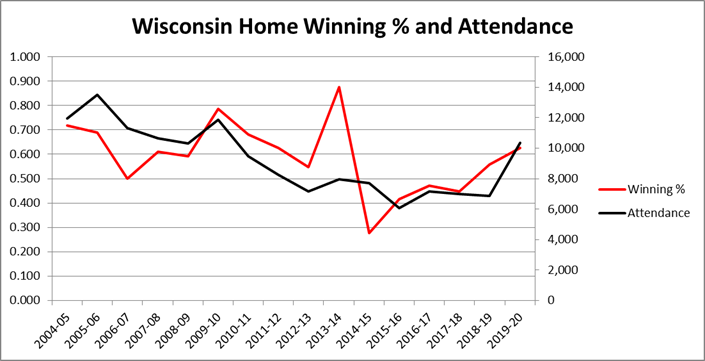
    "A long slide in crowd size for the University of Wisconsin men's hockey home games continued in the 2018-19 season.

    For the ninth time in the last 12 years, the average crowd for Badgers games at the Kohl Center was smaller than in the previous season.

    The average number of tickets scanned last season was 6,862, the second-lowest figure in 13 years of data. That's 39% lower than in the 2006-07 season, the first available for comparison.

    The ticket scans represent the actual number of people in the crowd for a game."


    Even with the "hyper-hype" of the incoming freshmen this year, season ticket sales were down, but walk-up sales were up; people are taking a "wait and see" attitude. With the very disappointing start, I'm not looking for any big crowds at the Kohl Center which looks empty even with 8,000 in the house.
    Last edited by MadCityRich; 12-25-2019, 04:45 PM.
    "Show me a good loser, and I'll show you a loser." Vince Lombardi

    "License to kill gophers by the government of the United Nations. Man; free to kill gophers at will. To kill, you must know your enemy, and in this case, my enemy is a varmint....and a varmint will never quit...ever. They're like Viet Cong...Varmint Cong, so you have to fall back on superior intelligence and superior firepower...and that's all she wrote. Au revoir, gopher." Karl Spackler 1980

    Comment


    • Originally posted by dxmnkd316 View Post
      A robust high school hockey community maybe only rivaled by Texas football and Indiana basketball.
      Maybe? Show me the Minnesota hockey equivalent of these:

      https://www.houstonchronicle.com/sports/highschool/article/Most-expensive-high-school-football-stadiums-Texas-13145194.php
      If you don't change the world today, how can it be any better tomorrow?

      Comment


      • B1G Attendance

        B1G Attendance


        Michigan's attendance was generally stable when they were in the CCHA, although it did drop their last two seasons in the league, 2011-12, when they had a very good home record, and 2012-13, when they had (for them) a poor home record. Since joining the B1G in 2013-14 their attendance has also been generally stable, albeit about 1,000 per game lower then most of their CCHA seasons.


        Michigan State's attendance mirror's its home record for 2004-05 through 2007-08 and then appears to lag and follow how the team did at home through the 2013-14 season, their first in the B1G. With the 2014-15 their attendance again seems to mirror their home record. So, overall, their is limited correlation between the two.


        Minnesota's attendance, of which a bit has already been written, was pretty stable while they were in the WCHA regardless of the team's home record. Starting with them joining the B1G attendance saw a 900 per game drop in average attendance despite an excellent home record that season. Attendance then began mirroring their home record until this season, when attendance has gone up, while their home record has gone down.


        Notre Dame's attendance does not track with their home record at all. The opening of their new arena led to a large increase in their average attendance which they have seen fluctuate over the seasons. Their last two seasons in the CCHA saw attendance increase, while their 4 seasons in Hockey East saw it fluctuate up and down, ending with their lowest average in the new arena. Their three seasons in the B1G have also fluctuated up up and down, but at least for the first two seasons with higher averages than their Hockey East seasons, including last season which was their highest average attendance in their new arena.


        Ohio State is another school who's attendance has not mirrored their home record much. However, their change of leagues from the CCHA to the B1G did lead to six straight seasons of increases in their average attendance. However, despite and excellent home record so far this season their attendance is currently down and they are at risk of not extending their attendance gains for a 7th straight season.


        Penn State's attendance has been strong and stable since their new arena opened and they joined the B1G in 2013-14. Their home record has also been very good since that first season in the B1G, so their attendance as pretty much mirrored their home record to date.


        Wisconsin's attendance has basically mirrored their home record, with the exception of their first season in the B1G, when they had a great home record, but only saw a modest increase in attendance. I have used the actual attendance figures from 2006-07 through last season. For this season I am using their reported attendance, so it is probably about 30% lower.

        Sean
        Last edited by Sean Pickett; 12-25-2019, 05:44 PM.
        Women's Hockey East Champions 2015, 2014, 2013, 2012, 2010
        Men's NCAA Champions 2009, 1995, 1978, 1972, 1971

        BU Hockey Games
        BU Hockey highlights and extras
        NCAA Hockey Financials
        Women's Division I Longest Hockey Games
        I need a kidney; looking for a donor

        Comment


        • Re: Average Men's Attendance

          With Omaha, some years were played in what is now the CHI, with a capacity of over 15,000. Those were their peak attendance years, but playing there wasn’t sustainable from a cost or atmosphere perspective

          Comment


          • Re: Average Men's Attendance

            Originally posted by Bale View Post
            It seems like a bit of a cop out for those schools in a large metro area. I get there are more options, but there are also more people for each of those options to pull from. For example, if you consider that the Gophers current average attendance is 8283 (yes, I know that's tickets counted not seats occupied, but that's the only consistent state we have to go on for all teams nationally. That's roughly 0.25% of the population of the MSP metro area. Compare that to UND which has a average attendance of 11,171 (or 10.9% of the population). Or Mankato which is at 4,484 (4.4% of the population). Generally speaking, the amount of options available are comparable with the level of population. I understand that options may have something to do with it, but it seems like that's a convenient excuse for MN.
            Your points are reasonable.

            But, the bottom-line is that nobody wants to spend money watching a loser, whether it be in an vibrant metro area (eg. The Twins) or in a back-water (eg. Maine) and people will show-up or ignore games in a converse fashion, too... (eg. North Dakota and BU).

            Too many entertainment options these days to expect blind fandom for a bad program, no matter where you live.
            Last edited by Fishman'81; 12-25-2019, 08:31 PM.

            Comment


            • Re: Average Men's Attendance

              Originally posted by LynahFan View Post
              Maybe? Show me the Minnesota hockey equivalent of these:

              https://www.houstonchronicle.com/spo...s-13145194.php
              In Minnesota, we don't need big, new, shiny arenas to play high school hockey in. The old barns have character and, for the most part, have great ice. A lot of the old barns have better sight lines than the newer rinks due to building codes now that limit how steep the incline of the seating can be. And most everyone knows that Minnesota hockey barns have the best concessions around!
              Millsy

              NCAA TOURNAMENT 2005, 2006, 2009, 2010!
              FROZEN FOUR 2009!


              "Like" The BeaverPond's Facebook Page

              BEMIDJI STATE BEAVERS!
              NAIA National Champs: 1968, '69, '70, '71, '73, '79, '80
              NCAA D-III National Champs: 1986
              NCAA D-II National Champs: 1984, '93, '94, '95, '97
              NCAA D-I National Champs: 20??
              Perfect 31-0 in 1983-84
              Holders of an NCAA Mens Record 43 straight wins (Nov. 8, 1983-Jan. 1, 1985)

              Comment


              • Re: Average Men's Attendance

                Originally posted by Fishman'81 View Post
                Your points are reasonable.

                But, the bottom-line is that nobody wants to spend money watching a loser, whether it be in an vibrant metro area (eg. The Twins) or in a back-water (eg. Maine) and people will show-up or ignore games in a converse fashion, too... (eg. North Dakota and BU).

                Too many entertainment options these days to expect blind fandom for a bad program, no matter where you live.

                I completely agree with you. I guess that was kind of my point. I'm not sure all the other entertainment options makes that big of a difference. Each program itself is what makes or breaks their attendance. It doesn't matter whether it's a metro area or if it's the only show in town.
                Mess with the bull, you get the horns.

                Comment


                • Re: Average Men's Attendance

                  Originally posted by Bale View Post
                  I completely agree with you. I guess that was kind of my point. I'm not sure all the other entertainment options makes that big of a difference. Each program itself is what makes or breaks their attendance. It doesn't matter whether it's a metro area or if it's the only show in town.
                  That's what I should have said.

                  Comment


                  • Re: Average Men's Attendance

                    Eager to see NMU's data. I know the experienced a bump with Grant coming on as coach, and now that NMU is winning again, seeing more butts in the seats at the Berry. It helps that teams like St. Cloud and Cornell are coming to visit.
                    Facebook: bcowles920 Instagram: missthundercat01
                    "One word frees us from the weight and pain of this life. That word is love."- Socrates
                    Patreon for exclusive writing content
                    Adventures With Amber Marie

                    Comment


                    • ECAC Attendance

                      ECAC Attendance


                      Brown's attendance loosely mirrors their home record, although it attendance still went down the past two seasons even though their home record improved both seasons. It appears that 11 seasons of losing home records (and 13 overall) have taken there toll and as attendance has fallen 60% since 2013-14, when they had hopes of building on a winning season in 2012-13, and is currently the smallest average attendance Brown has had since 2001. It is also the third smallest average for this season, only better than Sacred Heart, Niagara and St. Lawrence, which has played their games to date at the smaller capacity SUNY Canton rink. It remains to be seen if they can rebuild their fanbase or how long it will take.


                      Clarkson's attendance has remained strong, even when they have had seasons with bad home records. In general it has increased or remained relatively flat, and the only two large declines in attendance were in the back-to-back seasons of 2009-10 and 2010-11. This season's average is currently their highest since 2001 as they tend to be bucking the trend of lower attendance.


                      Colgate's attendance mas generally mirrored their home attendance, with the noticeable exception of 2015-16, the last season they played at Starr Rink, and 2016-17, the first season in the new Class of '65 Arena.


                      Cornell is another team that has had strong attendance for many seasons regardless of their home record, at least until 2009-10. After that season attendance began a downward trend which accelerated with the 2017-18 season before stopping in 2018-19 and which appears to be rebounding strongly this season.


                      Dartmouth's attendance has mostly trended down since 2005-06, regardless of their home record, although it did go up for the 2011-12 & 2012-13 seasons before trending back down.


                      Harvard is yet another team that has had a generally steady attendance regardless of home record.


                      Princeton's attendance has also not correlated well with their home record. It has even improved as their home record got worse and declined as their home record improved.


                      Quinnipiac's attendance is a bit interesting, as it show a better than doubling from 2004-05 to 2005-06 as they played played several home games at Ingalls Rink and one at the Harford Civiv Center, as well as pack 1,750 fans into the Northford Ice Pavilion for several games. Then in 2006-07 they opened their on campus arena halfway through the season as their attendance increased again. After that it has remained strong, and even increased 36% two seasons after a dip in the 2011-12 season. There was also almost no dip in 2017-18 despite a sub-0.500 home record.


                      Rensselaer's attendance also shows only a very loose relation to their home record. Overall it has decreased since the 2006-07 season, as losing home seasons (9) are nearly double that of winning home seasons (5).


                      St. Lawrence's attendance has mirrored their home record pretty well, with the exception of the three seasons from 2014-15 through 2016-17, when they had winning home records, but home attendance remained basically unchanged. This season attendance is way off, likely due in part to temporarily playing their home games at SUNY Canton. With their expected return to the renovated Appleton Arena later this season it will be interesting to see if attendance, and home record, improves.


                      Union's attendance mirrored their home record pretty well until the 2014-15 season. That season saw their average attendance peak, despite a losing home record, likely because of their national championship. Attendance has remained strong since, although there are signs it may be weakening, as attendance is currently down for the third straight season and is 12% off their peak attendance of 2014-15.


                      Yale's attendance has also not mirrored their home record. It remained strong from 2004-05 through 2008-09, but decreased over that time despite their home record improving every season from 0.233 to 0.694. Attendance improved after that and then remained strong. It also received a boost for several seasons after winning the national championship in 2013, even though their home record regressed. Their attendance took a drop last season despite a solid home record and has tumbled by 33% so far.
                      Women's Hockey East Champions 2015, 2014, 2013, 2012, 2010
                      Men's NCAA Champions 2009, 1995, 1978, 1972, 1971

                      BU Hockey Games
                      BU Hockey highlights and extras
                      NCAA Hockey Financials
                      Women's Division I Longest Hockey Games
                      I need a kidney; looking for a donor

                      Comment


                      • WCHA Attendance

                        WCHA Attendance


                        Alabama-Huntsville's attendance appears to slightly mirror their home attendance, but a closer look shows that some seasons it had smaller, larger or no gains and drops than their home record. For example, attendance spiked during the 2008-09 season, despite only a modest improvement in their home record before dropping back into the range it had been in. After the demise of the CHA and UAH having to go independent attendance took a big hit, dropping by a third between 2009-10 and 2010-11. It improved some the following season, which was possibly the most tumultuous in the team's history as the program was terminated and then saved. The campaign to save the program also led to a 35% attendance gain in 2012-13 and their joining the WCHA the following season led to another small increase in attendance. However, since their first season in the WCHA their attendance has drifted downward and is currently 22% lower than that season. Seven straight seasons of losing home records (and 12 out of 13) certainly has played a part in the lower attendance and a few winning seasons at home would likely increase attendance again.


                        Alaska's attendance, has generally trended downward since 2004-05. Attendance dropped in seasons in which they had losing home records, but didn't increase in seasons when they had winning home records. The move from the CCHA to the WCHA probably also contributed to lower attendance (their average attendance from 2004-13 was 3,155 and from 2013-20 it has been 2,371) along with five straight seasons of sub-0.500 home records.


                        Alaska-Anchorage's attendance has seen a long steady decline, going down in 12 of the past 14 seasons. The new WCHA also didn't seem to interest their fans, as attendance dropped in 2013-14 despite an excellent home record that season. The attendance attrition seemed to be blunted in 2016-17 when they had an attendance bump that was then mostly retained for the following two seasons, despite horrible home records. However, due to the massive budget cuts imposed on the school all home games were moved to their 750 seat on campus rink in 2019-20. This has had a major impact on attendance, as the limited seating is just 39% of their average attendance for the 2018-19 season.


                        Bemidji's attendance mirrored their home record from 2004-05 through 2009-10, but with the opening of their new home arena any correlation between the two appears to have disappeared. After an increase for the first season in their new arena attendance trended down until it stabilized for the past 2-and-a-half seasons.


                        Bowling Green's attendance does have some correlation to their home record, but not too much so. The move from the CCHA to the WCHA also appears to have caused a drop in attendance in 2013-14, but it rebounded in 2014-15.


                        Ferris State's attendance also roughly mirrors their home record, but the season to season changes are not nearly as sharp as their season to season home record changes. And after reaching a peak in attendance in 2014-15 they have had 5 straight seasons of declining attendance despite having three seasons with winning home records.


                        Lake Superior's attendance had a slight downward trend from 2004-05 through 2015-16 as it was not affected much, if at all, by their home record. However, for the past three-and-a-half seasons their attendance has mirrored their home record very closely.


                        Michigan Tech's attendance has mostly mirrored their home record, although it has not fluctuated as much from season to season. It is also not mirroring their home record this season to date, as attendance is up despite a sub-0.500 home record.


                        Minnesota State's attendance has shown a slight correlation to their home record, but with far less fluctuation. They have also seen their attendance trend upward over the past eight seasons and are currently just 1.5% off their peak season of 2008-09.


                        Northern Michigan's attendance also shows a general mirroring of their home record. The move from the CCHA to the WCHA appears to have impacted their attendance, as it dropped 20% their first season in the WCHA and then another 18 % over the next three seasons. With the hiring of Coach Potulny their attendance has improved each of the past 2-and-a-half seasons, even though their home (and overall) record has not been as good as his first season.

                        Sean
                        Women's Hockey East Champions 2015, 2014, 2013, 2012, 2010
                        Men's NCAA Champions 2009, 1995, 1978, 1972, 1971

                        BU Hockey Games
                        BU Hockey highlights and extras
                        NCAA Hockey Financials
                        Women's Division I Longest Hockey Games
                        I need a kidney; looking for a donor

                        Comment


                        • Re: Average Men's Attendance

                          This is great stuff, Sean. Thanks!

                          Comment


                          • Originally posted by Fishman'81 View Post
                            This is great stuff, Sean. Thanks!
                            Agreed; great work, Sean!

                            AHC teams next? :-)

                            Comment


                            • Atlantic Hockey Attendance

                              Atlantic Hockey Attendance


                              Air Force's attendance doesn't mirror their home record as much as it lags it by a season. However, like many teams their attendance has trended down since the 2010-11 season and is currently 31% off their average for that season. They did enjoy an attendance bounce from 2015-16 through 2017-18, but that has been lost the past season-and-a-half.


                              Army's attendance shows no relationship to their home record, even increasing when they had a winless season (0-12-3 in 2011-12) and a one win season (1-13 in 2013-14). This season has seen their attendance drop to its lowest average since at least the 2001-02 season, despite a current winning home record.


                              AIC's attendance was pretty flat when they played at the Olympia Ice Center through the 2015-16 season regardless of their home record (which was sub-04.00 for all but one season). However, everything changed with the 2016-17 as the team got a new head coach, home games were moved to the MassMutual Center, and the team started winning at home. That first season, 2016-17 saw only a slight improvement on the ice, but attendance almost doubled (from an average of 217 to 418) in the better facility. The following season both their home record (their first winning home record since before 2004) and attendance (an average of 683) increased substantially. Their home record has improved the past season-and-a-half, while attendance as dropped slightly, but is still much better than before the move. For AIC the commitment by the school to the hockey program has made for positive gains on the ice and in growing their fanbase.


                              Bentley's yet another team who's attendance has not been reflective of their home record. Playing in an older public off-campus rink kept their attendance low, even when they had winning home records. When their new on-campus arena opened late in the 2017-18 their attendance ticked up and saw a nice increase for their first full season in their new home, while this season has seen another nice increase to date.


                              Canisius' attendance mirrored their home record from the 2004-05 season until they moved into The Rinks at Harborcenter. After moving into their new home attendance remained stable for three seasons, before again mirroring their home record for the following season and this season to-date.


                              Holy Cross' attendance has also mirrored their home record, although several seasons it lagged their home record by a season. To date this season has been an exception, with attendance up, while the team has been winless at home.


                              Mercyhurst' attendance has mirrored their home attendance some seasons and not done so other seasons. The biggest divergence started in 2015-16, when they had the same home record as the previous season, but attendance improved 36% and then remained near that level the next three seasons despite sub-0.500 home records for two of the seasons. This season attendance has dropped significantly and is currently 11% lower than the 2014-15 season.


                              Niagara's attendance has loosely followed their home record, although from 2012-13 through 2017-18 it dropped at a slower rate their their home record. It then continued to dropped the following two seasons, even through their home record improved both seasons.


                              RIT's attendance vaguely mirrors their home record, but the opening of their new home arena saw in increase in their average attendance 56%. The following season saw attendance rise again, despite a losing home record, but the following three-and-a-half seasons has seen their attendance more closely mirror their home record.


                              Robert Morris' attendance mirrored their home record slightly until the 2012-13 season, when attendance dropped while their home record improved. Since then their attendance has more often then not increased or decreased in an inverse relationship to their home record.


                              Sacred Heart's attendance generally mirrored their home record from 2004-05 through 2012-13 as both trended downward. Attendance dropped the following season and bottomed out in 2014-15 even though they had a winning home record that season. The move to Webster Bank Arena with the 2016-17 season has helped their attendance improve somewhat, but a continued lack of success on the ice has done nothing to draw new fans. A proposed on campus arena may be able to do for Sacred Heart what Bentley's new arena has done for them, but winning home games would also help as it has helped AIC.

                              Sean
                              Women's Hockey East Champions 2015, 2014, 2013, 2012, 2010
                              Men's NCAA Champions 2009, 1995, 1978, 1972, 1971

                              BU Hockey Games
                              BU Hockey highlights and extras
                              NCAA Hockey Financials
                              Women's Division I Longest Hockey Games
                              I need a kidney; looking for a donor

                              Comment


                              • Independents Attendance

                                Independents Attendance


                                Arizona State's attendance has not mirrored their home record in their short history. The two main reasons are that they play most of their home games at Oceanside Ice Arena, which only holds 750 spectators, with others played about 30 miles away at Gila River Arena and in 20161-17 two games at the Prescott Valley Event Center about 100 miles away. The second reason is their first season they only played 7 home games against NCAA varsity teams, 5 at Oceanside and 2 at Gila River which had just over 5,000 and just under 3,800 fans for those 2 games. Those two games accounted for 72% of ASU's total home attendance that season and significantly raised their average attendance. In 2016-17 they played 7 at Oceanside, 4 at Gila River at 2 at the Prescott Valley Event Center. Of the 4 games at Gila River, only one drew over 3,000, 2 drew about 1,800 and one drew just 853, while the 2 games at the Prescott Valley Event Center drew just over 1,150 and 814. So, with smaller crowds at the larger arenas ASU's attendance dropped significantly. For the 2017-18 season they played 10 at Oceanside and 4 Gila River and the attendance for those 4 games were better overall, again raising their average attendance. For 2018-19 they played 13 at Oceanside and 3 at Gila River, but besides the larger crowds at the 3 Gila River games they also started to allow about 175 more fans into Oceanside Ice Arena for each game, which also helped to maintain their attendance average. This season attendance is down, with 7 games at Oceanside and only 1 at Gila River and with all 8 remaining home games at Oceanside their average for this season will decrease regardless of their home record. However, playing most games in Tempe and the strong fans support they have bodes well if their proposed 4,500 seat on campus arena is built in the near future.

                                Sean
                                Women's Hockey East Champions 2015, 2014, 2013, 2012, 2010
                                Men's NCAA Champions 2009, 1995, 1978, 1972, 1971

                                BU Hockey Games
                                BU Hockey highlights and extras
                                NCAA Hockey Financials
                                Women's Division I Longest Hockey Games
                                I need a kidney; looking for a donor

                                Comment

                                Working...
                                X